Kubernetes Observability and Scaling Platform
This repository documents the observability and autoscaling architecture for operating Kubernetes workloads in a production-style platform environment.
The focus is on building operational visibility and reliable scaling behavior across a Kubernetes cluster running on AWS.
Observability Architecture
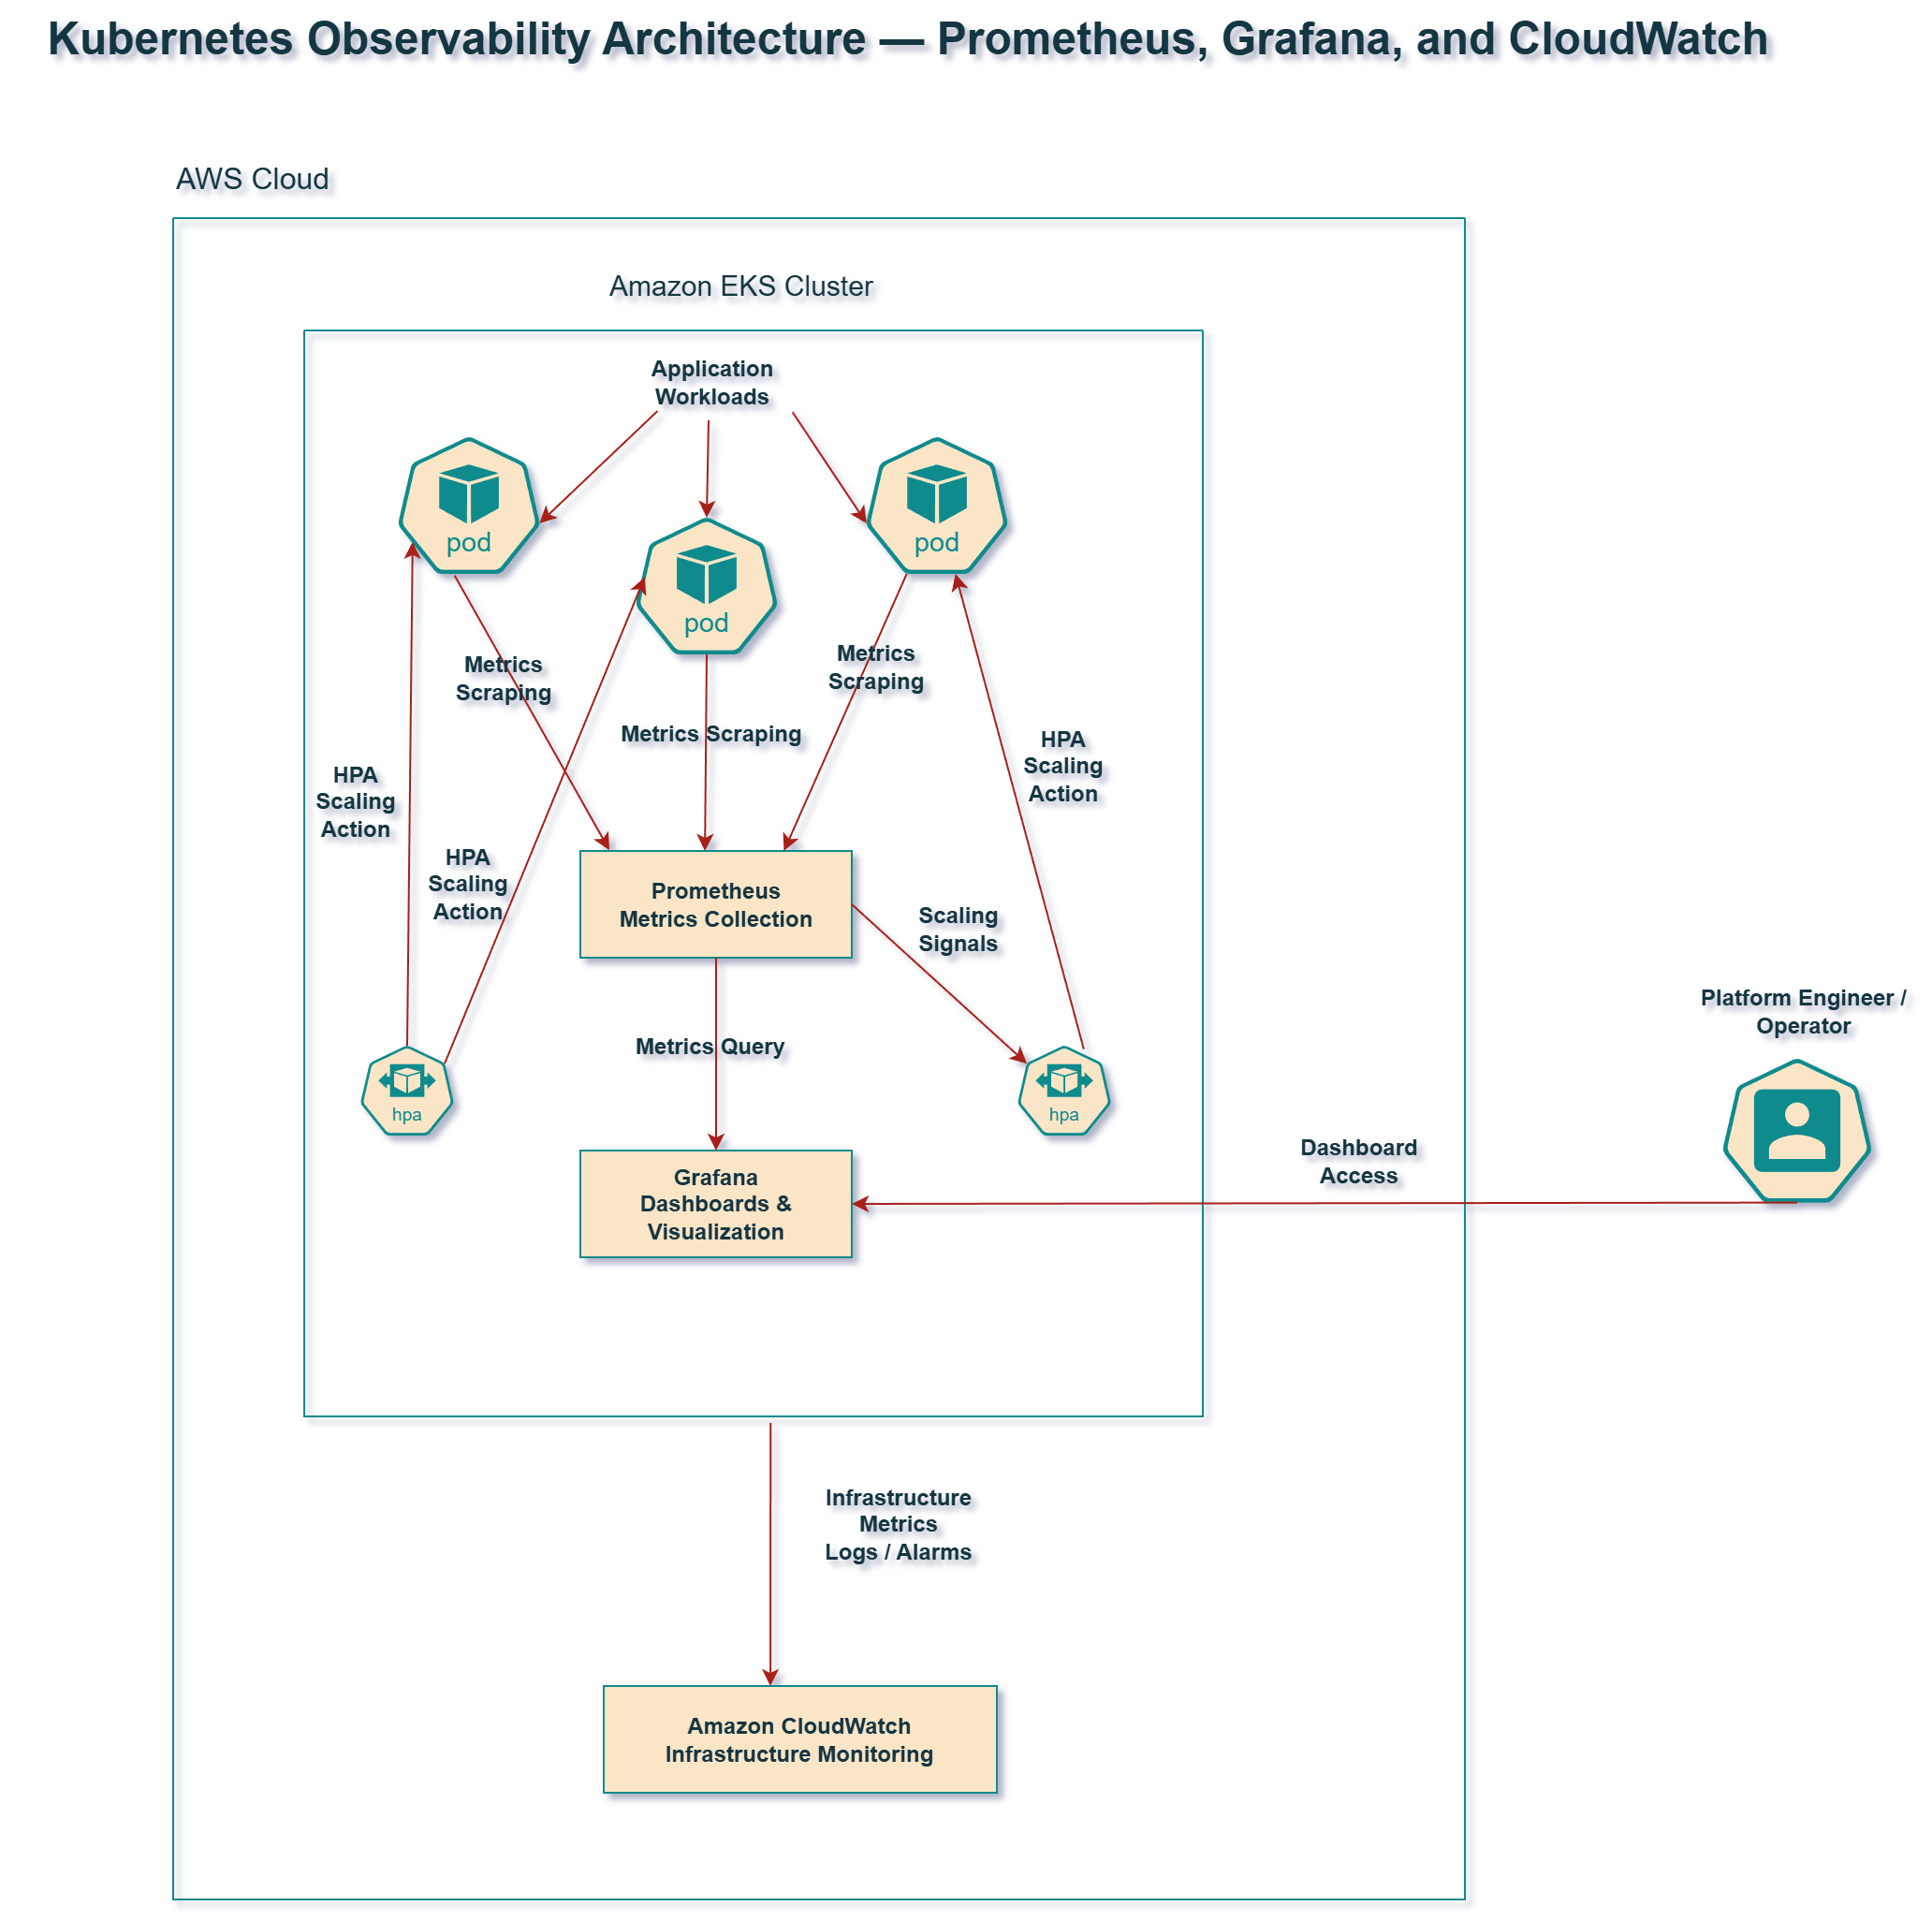
The observability layer provides insight into:
- Kubernetes workloads
- cluster health
- infrastructure metrics
- application performance
Prometheus collects metrics from workloads and cluster components.
Grafana provides dashboards for visualization.
CloudWatch provides AWS-native monitoring for infrastructure components.
Metrics and Alerting Flow
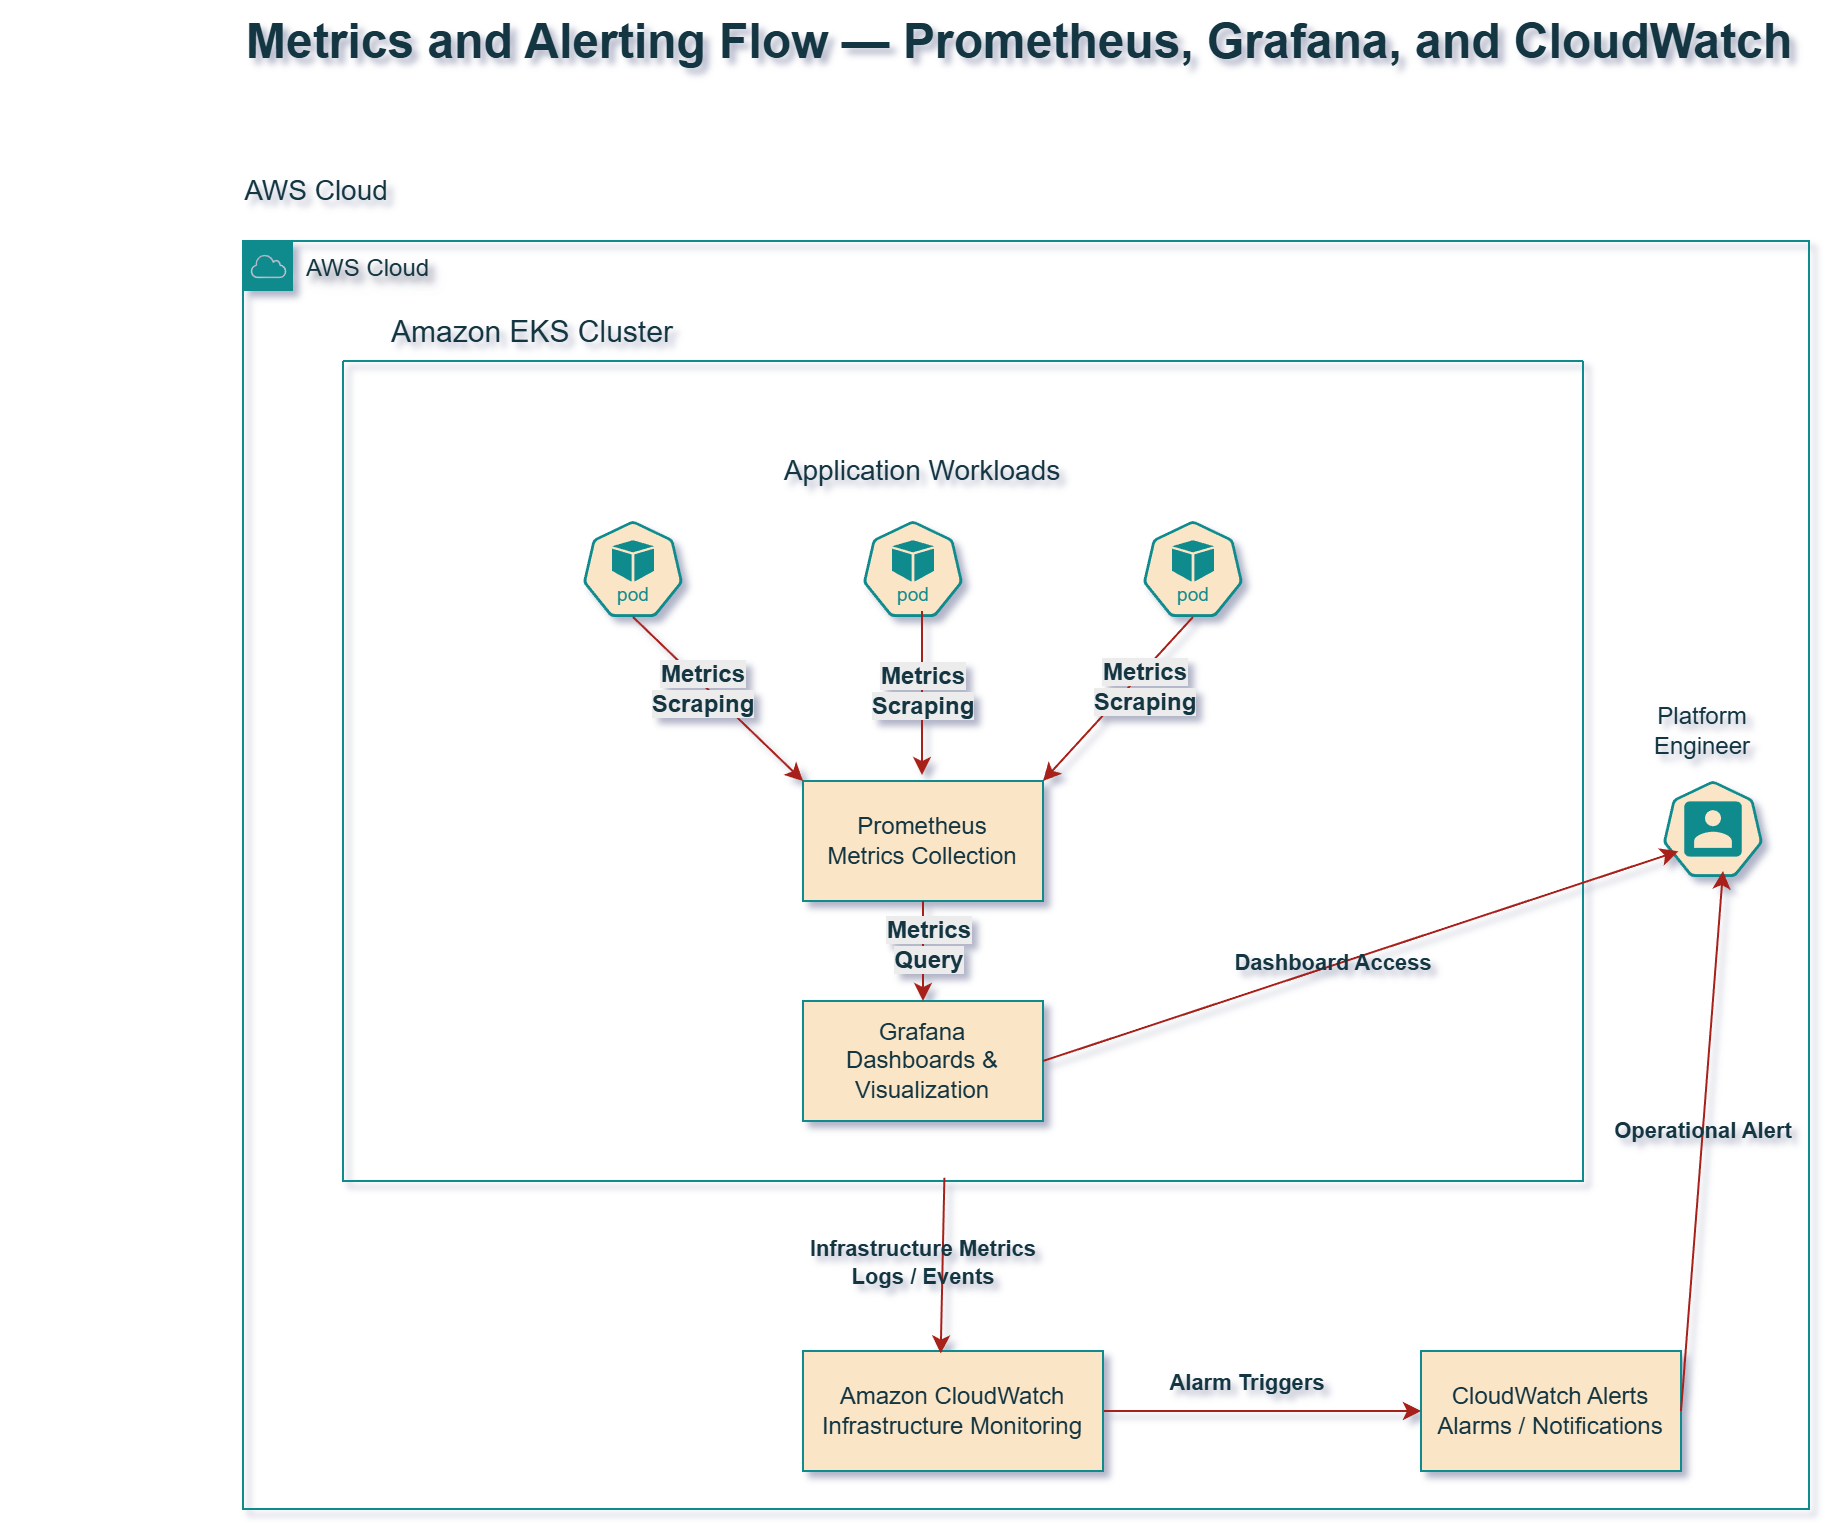
Metrics flow through the platform as follows:
- Workloads expose metrics
- Prometheus scrapes metrics
- Grafana visualizes dashboards
- CloudWatch monitors infrastructure signals
- Alerts are generated when thresholds are exceeded
This model provides both application-level and infrastructure-level visibility.
Autoscaling Architecture
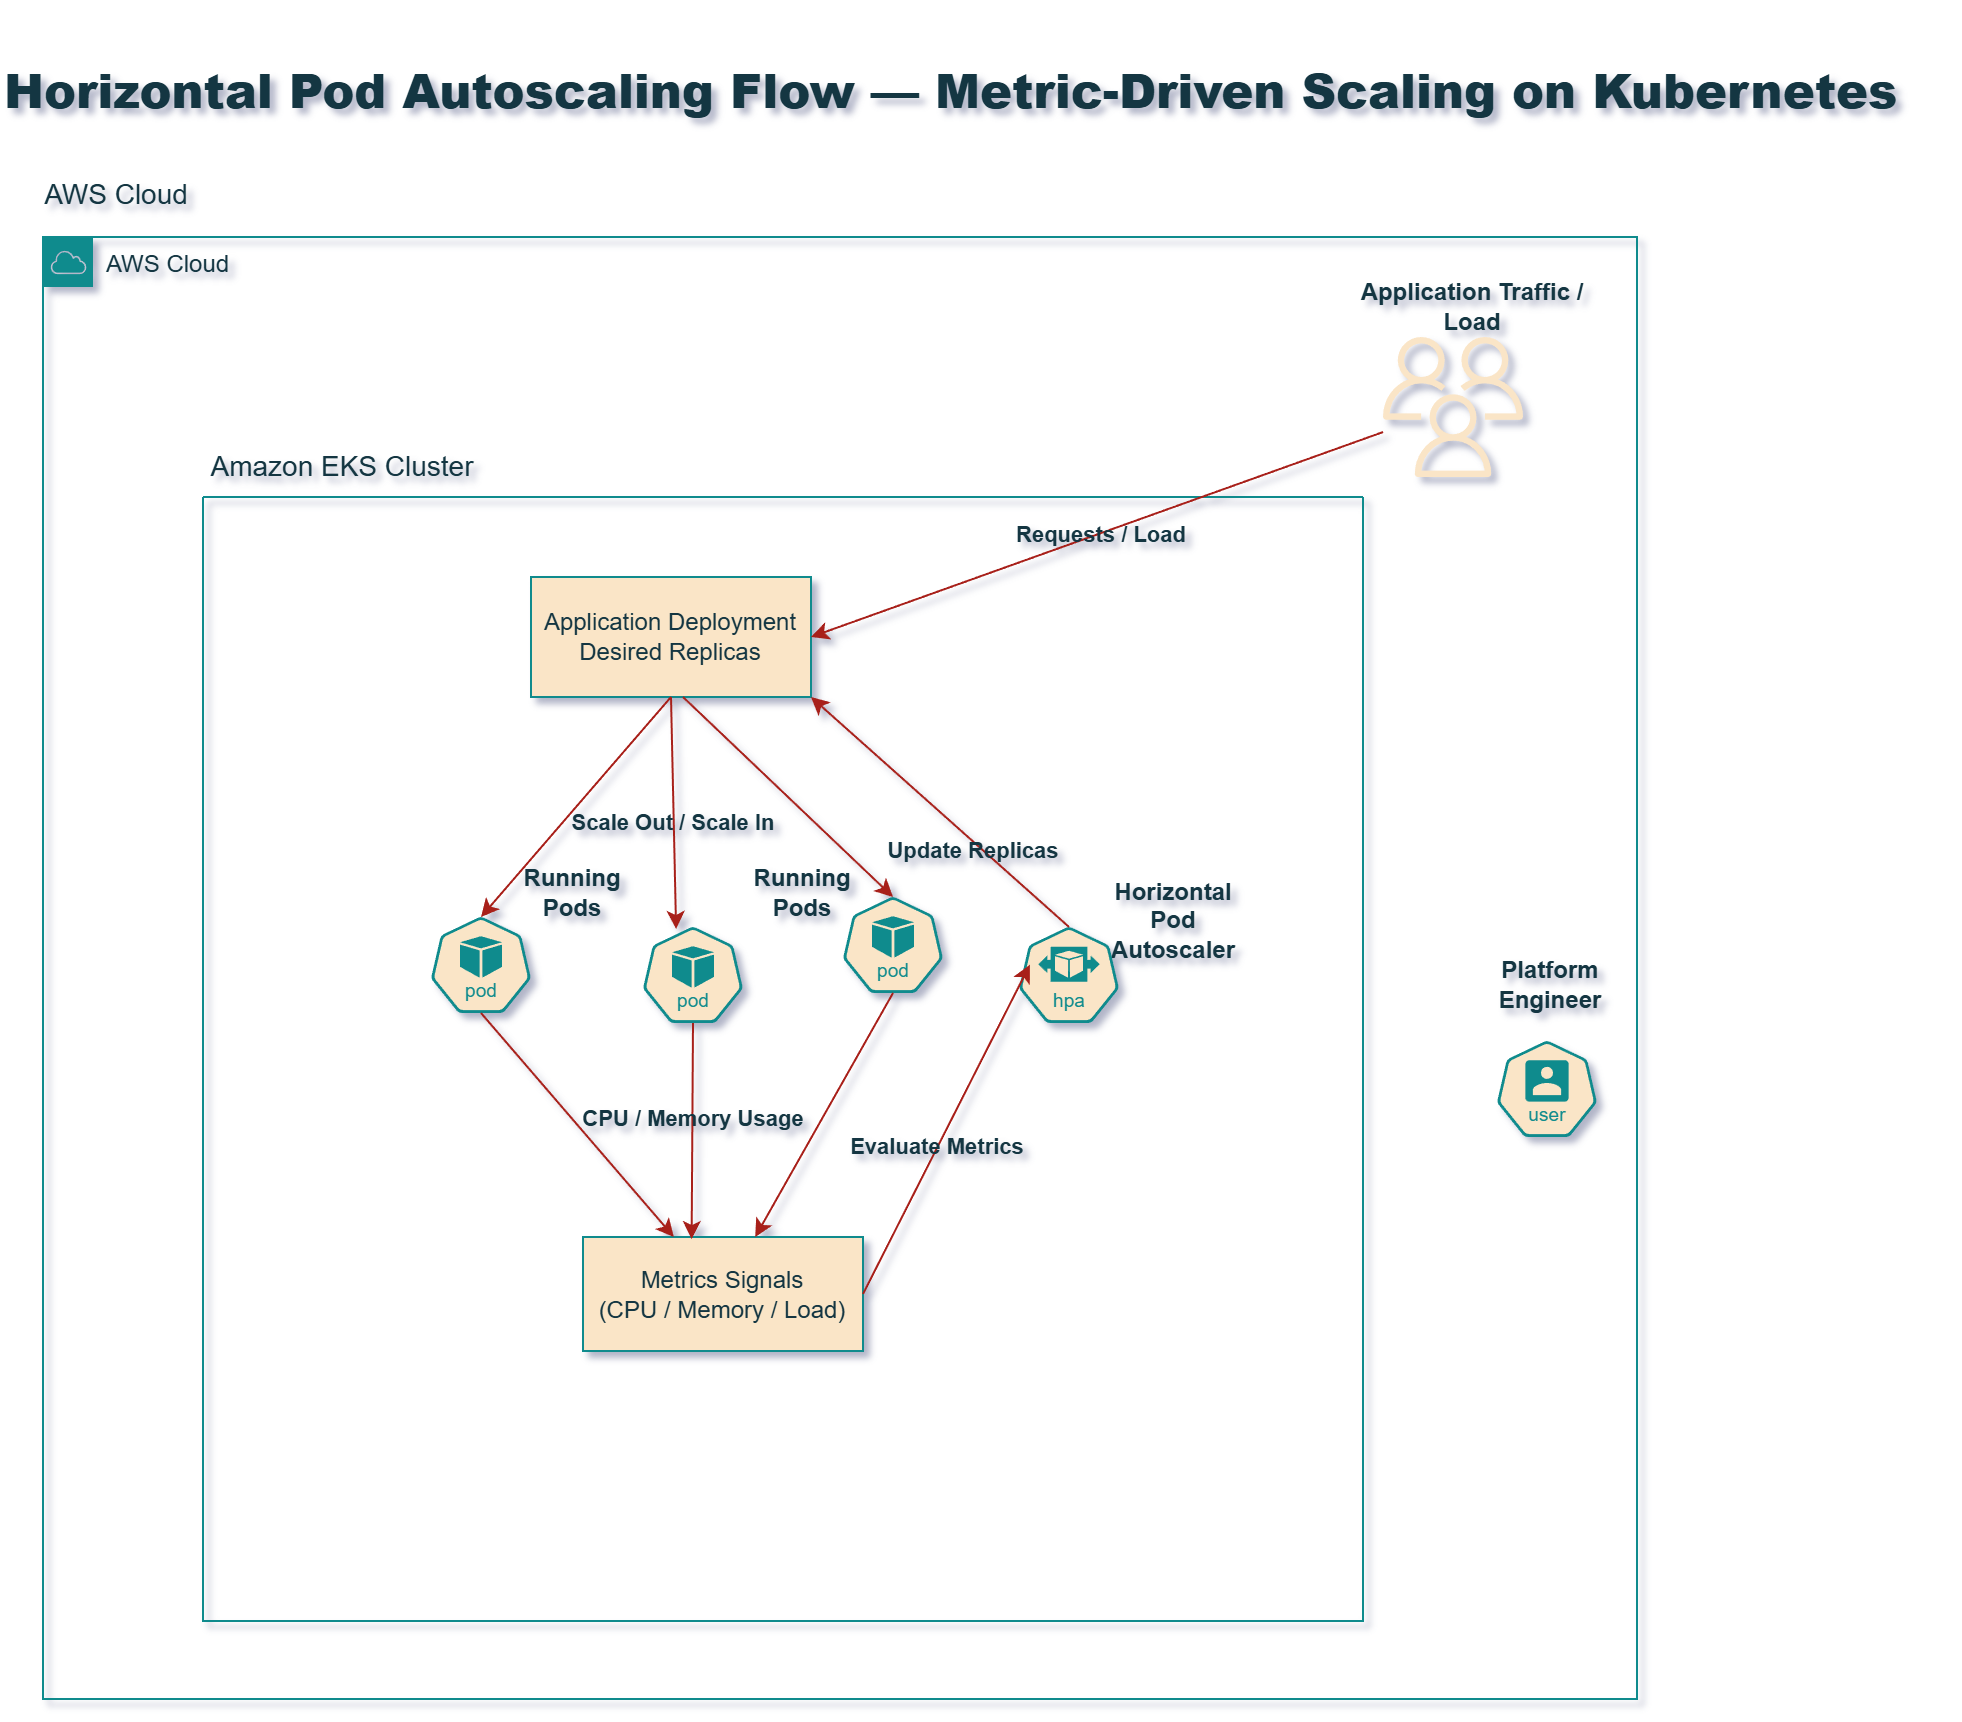
Horizontal Pod Autoscaling allows workloads to scale based on demand.
The HPA controller evaluates metrics such as:
- CPU utilization
- memory usage
- request load
Based on these metrics, Kubernetes increases or decreases the number of running pod replicas.
This ensures applications remain responsive under load while minimizing resource waste.
Documentation Map
Platform Observability
Scaling Design
Platform Operations
Engineering Goals
This repository demonstrates how to design a Kubernetes environment that is:
- observable
- scalable
- operationally reliable
- capable of supporting production workloads
It complements infrastructure provisioning and GitOps delivery systems by focusing on runtime platform operations.
Author
Christine Adelusi
Senior DevOps / Platform Engineer
AWS • Kubernetes • Prometheus • Grafana • CloudWatch • Autoscaling